

In the first part of this blog series, we will learn about Picking up the right tools for App Performance Improvement and then move towards Demystifying the SysTrace to crack Performance Optimisation in the second part.
When we talk about a quality Android Application, some of the major markers are App Startup and Screen Rendering (Slow frames/Frozen frames) times. App Startup because users expect an app to be responsive and quick to load. Any slowness here, can lead to users dropping off without even exploring your home screen. Similarly Slow rendering means screen transitions, animations and scrolls are not going to be smooth, leading to a poor experience for users. Frozen frame – an extreme form of Slow rendering, is even worse because your app appears stuck and is not able to accept any user input. Fixes to these problems, are not always straightforward, trivial or intuitive for an Android Developer. Nevertheless, if you go for appropriate tools and methodised approach, performance gains are bound to happen. And this is exactly what we are going to discuss here.
SysTrace to the rescue !!
System trace is a record of system activity over a short period of time saved into a trace file. It produces a report that shows a very precise picture of timing information across all processes running on your device at the system level. In short, it can tell where your app is spending its time and what is going on inside the system at that particular times. No wonders, this is evidently the favourite tool of Android Performance Team at Google.
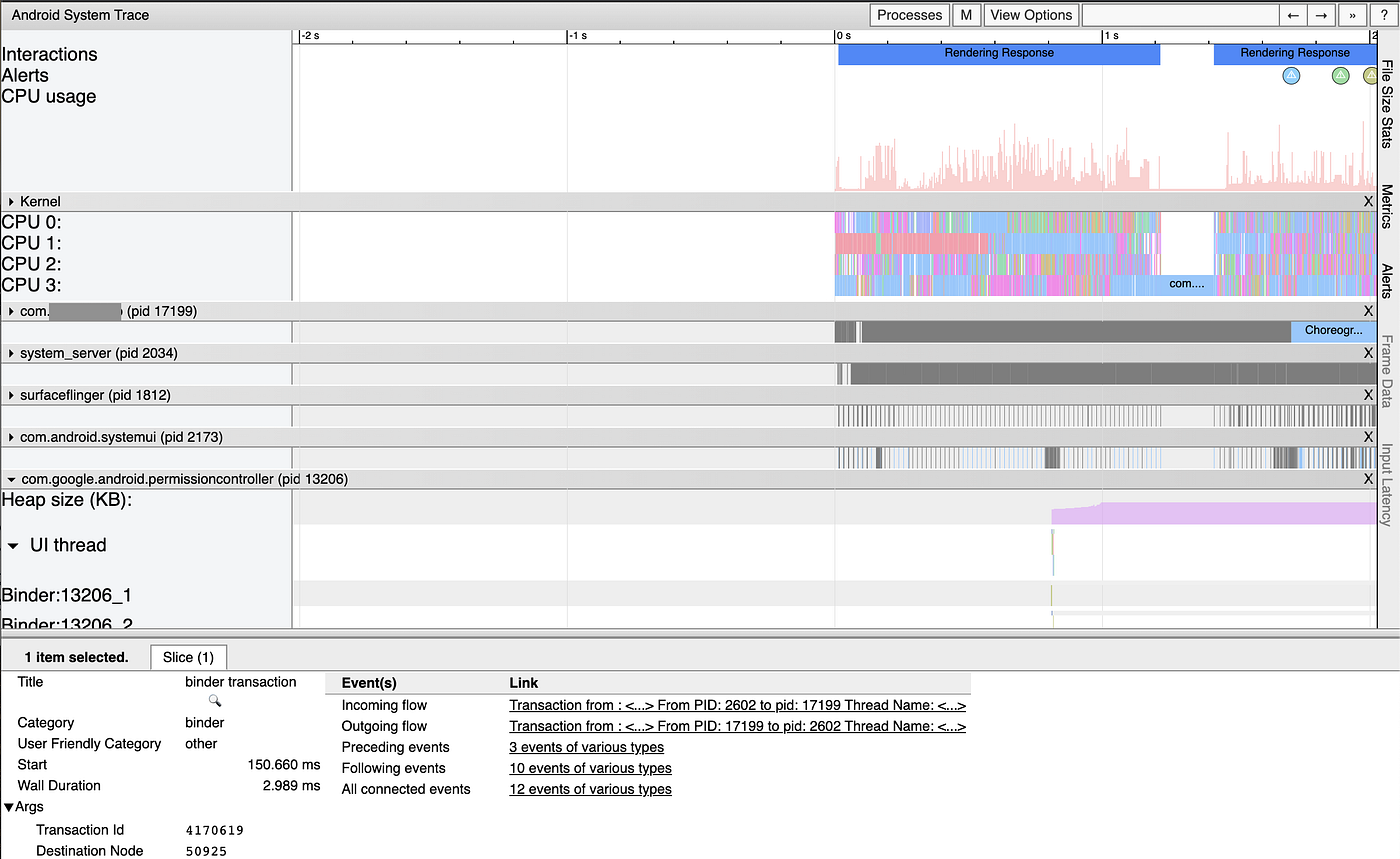
We will see in a while, how it is captured and viewed, but before that let’s see how a Trace report looks like :
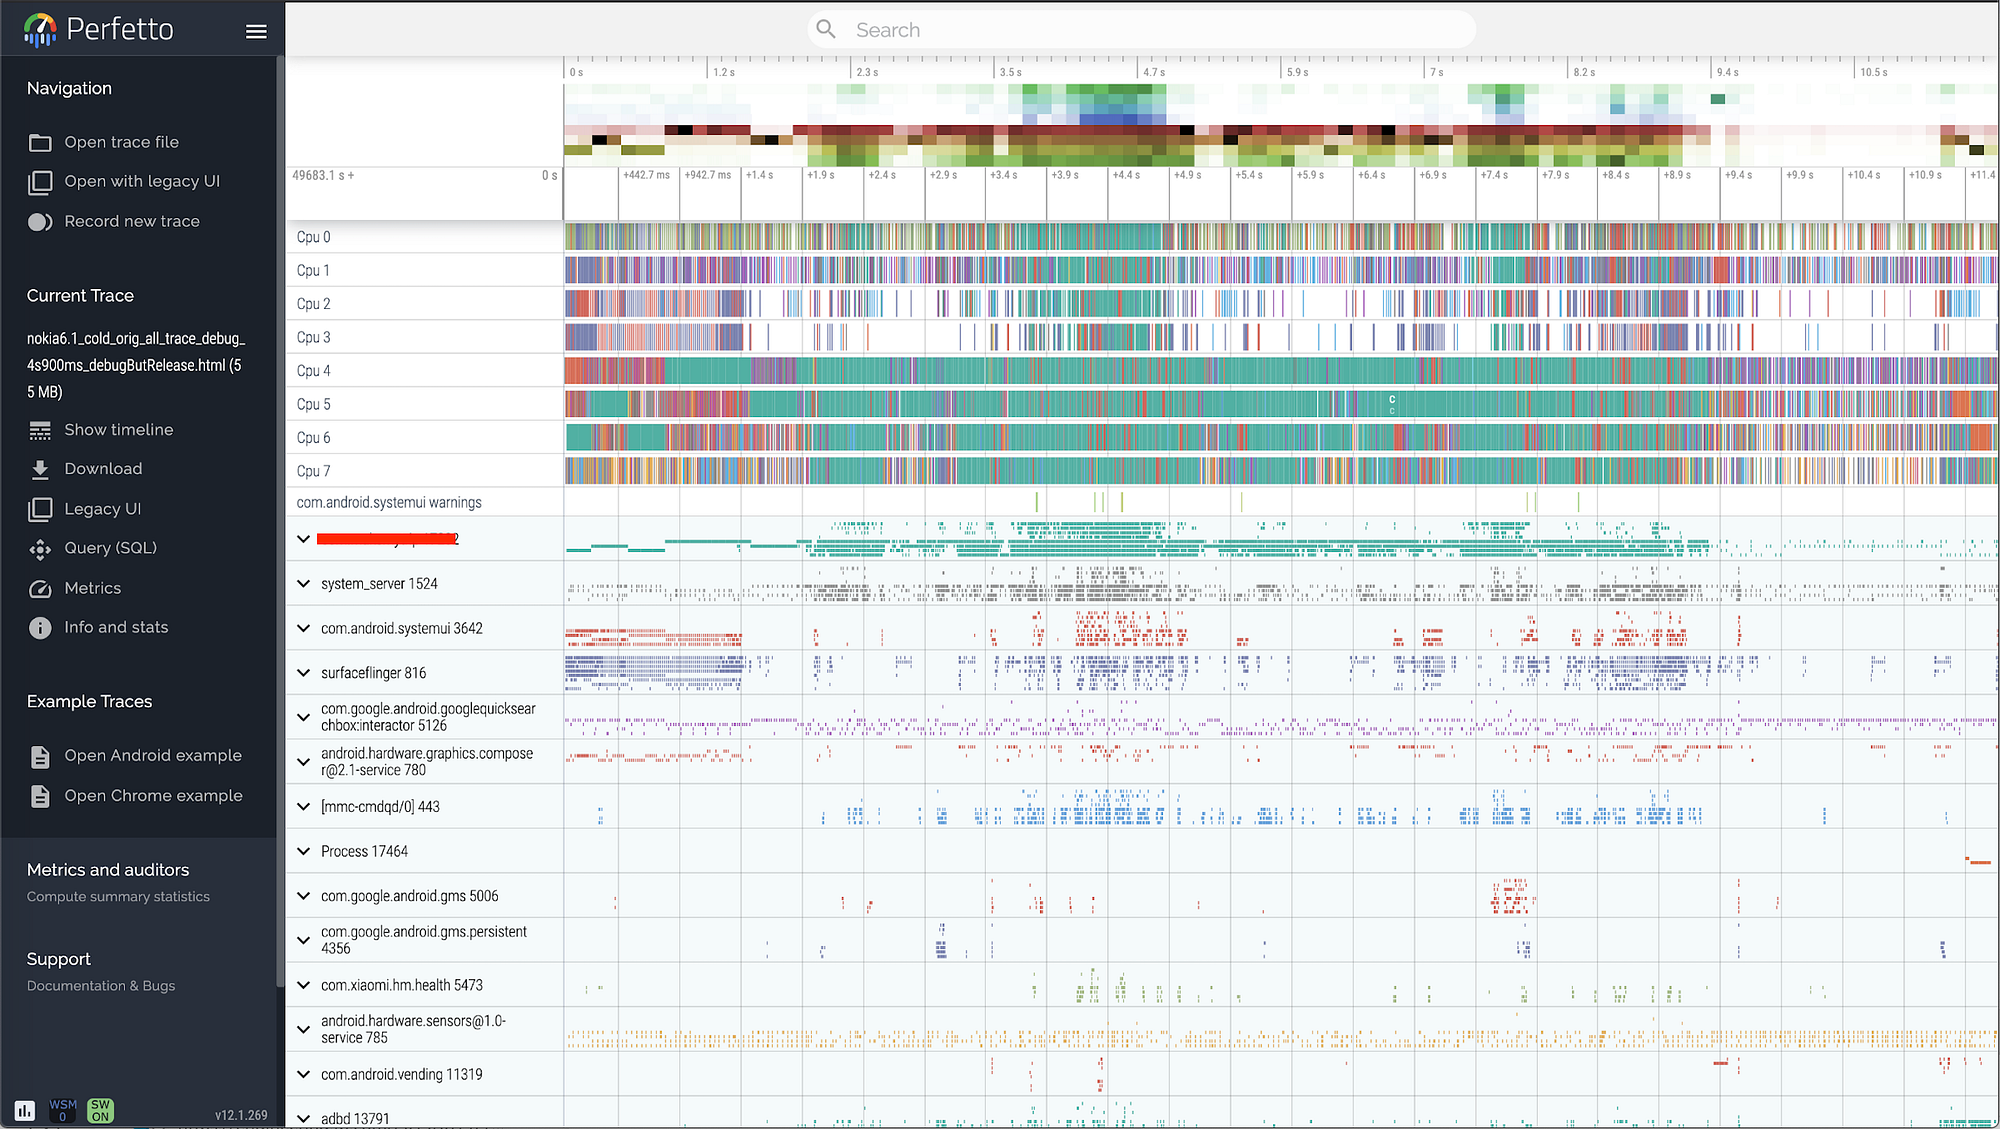 Sample Trace Report
Scary — Isn’t it ? Don’t worry. By the time you will reach the end of this series, you will have enough ammunition and motivation to start exploring this.
How to capture TraceView ?
There are multiple ways with their own pros and cons. Lets discuss them one by one.
- CPU Profiler — Android Studio → Profiling → CPU → Trace System Calls.
The result looks like below :
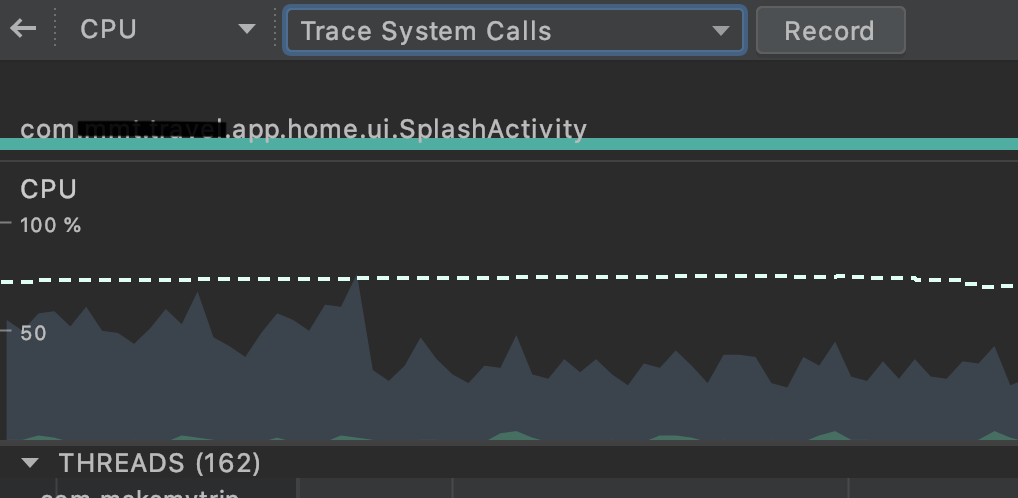 Tracing on Android Studio
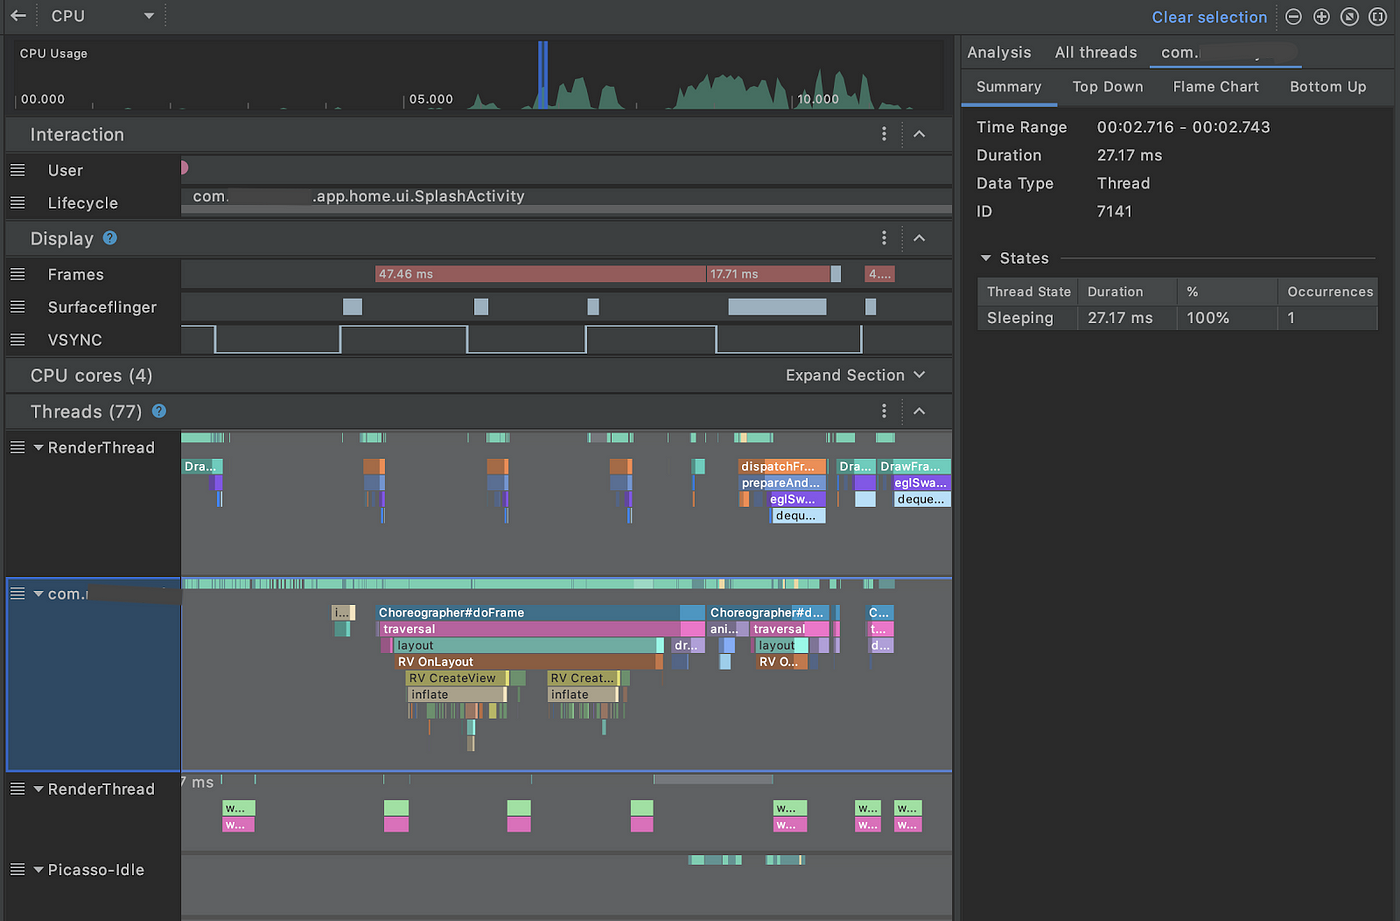 Android Studio built in Trace Visualisation tool
 Timing info.
Jobs
Pros and Cons:
The upside of using this approach is :
- No setup required ( Other than Android Studio of-course )
- Lot of useful information like user touch events, application lifecycle events, frame times, Render thread , Vsync cycles are readily available in a concise manner. This can be a life-saviour for beginners.
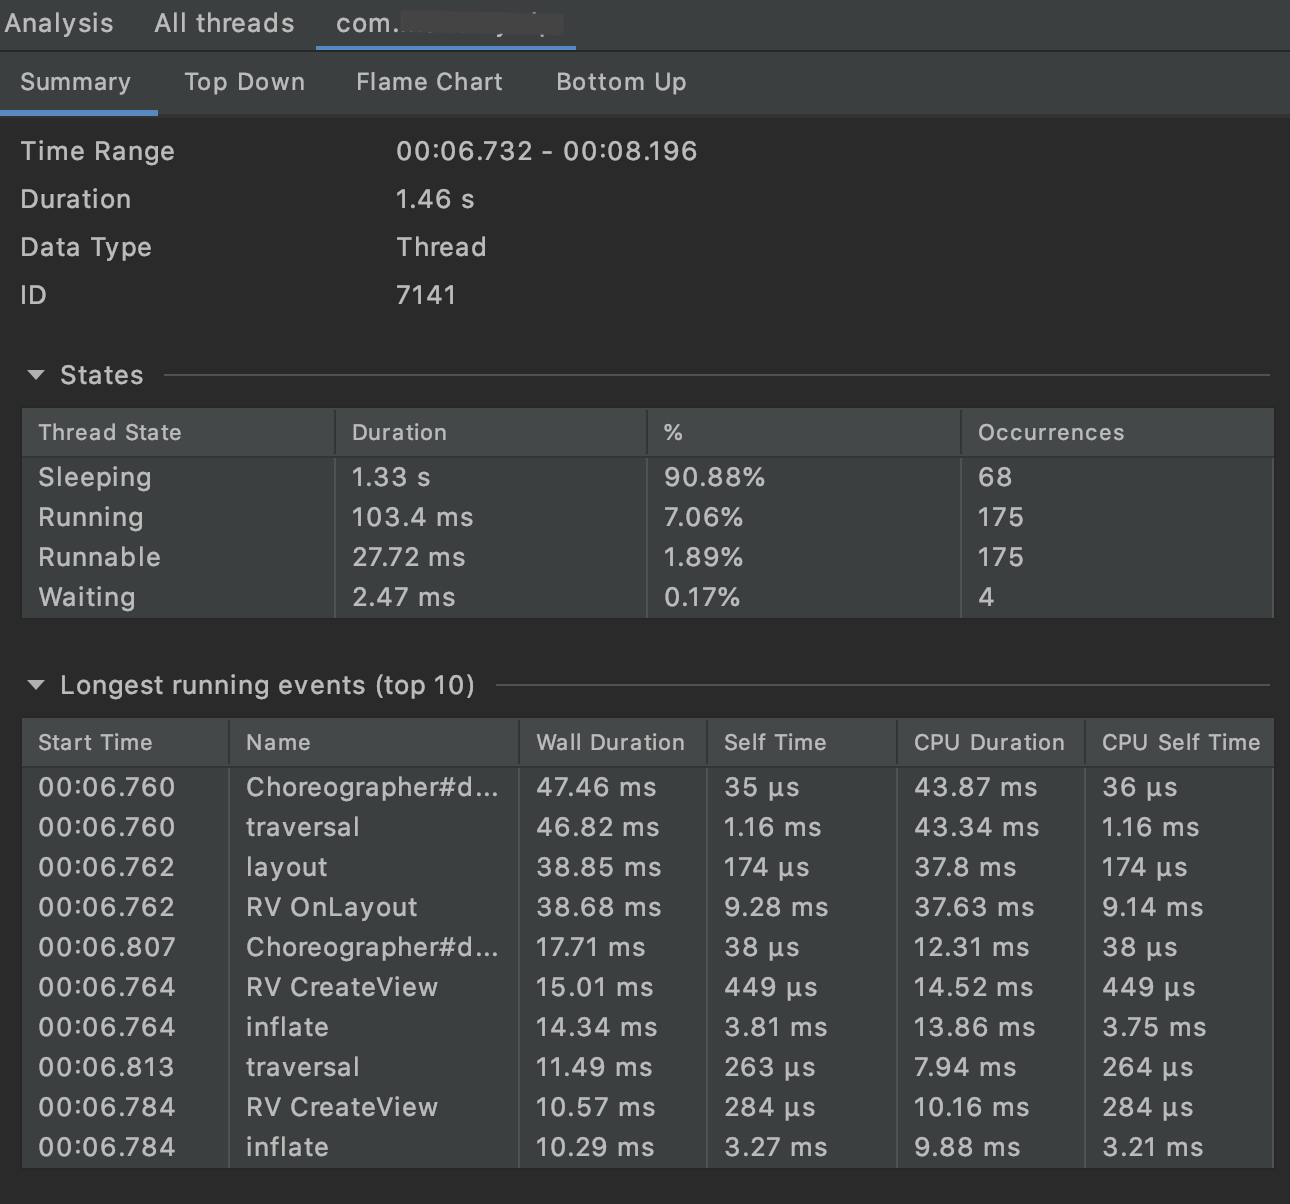
- Availability of timing information of various tasks and pre-cooked list of most time taking functions, flame-charts and much more.
But there are definite downsides which might act as a deterrent :
- This recording through Ui is heavy on the system. ( Laptop/Desktop)
- Lot of overheads involved which makes the mobile device perform too slow.
- Especially for capturing the App launch which involves loads of initial work, the launch time is increased by n times and trace recording becomes jittery or frozen too at times.
- Intermediate or Advanced analysts may find it short of features and functionality to explore the true potential of SysTrace. Will see this later.
Update : Latest versions of Android Studio ( 4.2+) are reporting much improved recording performance and lesser overheads. Do give it a try.
2. Capture systrace using command-line — This is much efficient way of capturing the trace though it requires very minimal setup initially. (like python installation)
The command used to capture trace may look something like this :
python systrace.py am binder_driver camera dalvik freq gfx hal idle input res sched view wm -a [Application package] -o [Output File Name]
This enables the tracing of the information like activity manager, window manager, graphics etc. and should provide sufficient info for any beginner to intermediate analysis.
The overheads are much lesser and the performance degradation on the Android device is also minimised. If used along with proper visualisation tool, it opens up numerous possibilities to explore system info.
Starting Android 10, Perfetto is the new tracing tool introduced which offers superset of information provided by Systrace. Even the support to capture trace directly in Android device is available using Quick Settings Panel and then share via available sharing apps. More information on the different ways to take the trace can be found out here.
Visualisation Tool
Legacy UI — The trace report generated using Systrace command line is an html file which can be viewed on any browser of your choice. But the user interface and navigation is not optimum ( only WASD keys, no touchpad support). The options are also a bit limited due to which next option is mostly preferable. There are few exceptions where Legacy UI can be more useful. This will be discussed in next part.
 Legacy UI — Sample Trace
Perfetto UI
The Perfetto Web-based trace viewer opens traces and displays complete report. This is a wonderful tool with excellent user interface, easy navigation options, availability of touchpad zoom in/zoom out and scroll. Search for a particular trace is user friendly and pinning the required thread is also available.
 Perfetto UI — Pinning the tasks available.
Custom Traces
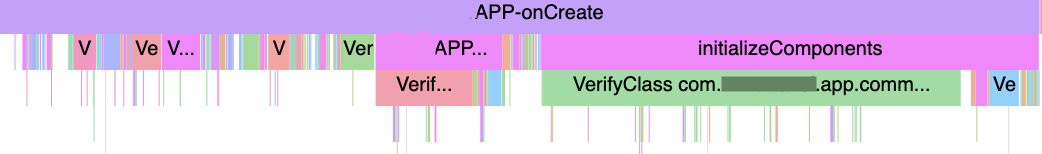
More often than not, system provided traces might not be enough to debug the performance issues. They can provide an overall timing info, but to dive deeper you will need to add custom traces. This involves specifying and tagging the start and end of a particular function/section. ( Important: It needs debuggable true )
As a very good example, System trace can tell you the timelines for bindApplication, Activity Start, and Activity Resume.
But in order to get deeper info, like suppose initComponents being called in Application onCreate, and you want to capture how it is behaving, adding a custom trace will plot the section on trace which can then be analysed.
Now that we know about capturing a trace, in the next section we will see what all information we can extract from the trace report and how to use that.

