

This is the second blog of the series. In the first part, we learnt about Picking up the right tools for App Performance Improvement. In this part, we will dive deeper and try to understand how to utilise the most informative tool among all i.e System Trace.
Demystifying the System Trace for Android App Performance
So as we saw in the last post also, a common Systrace report looks like this.
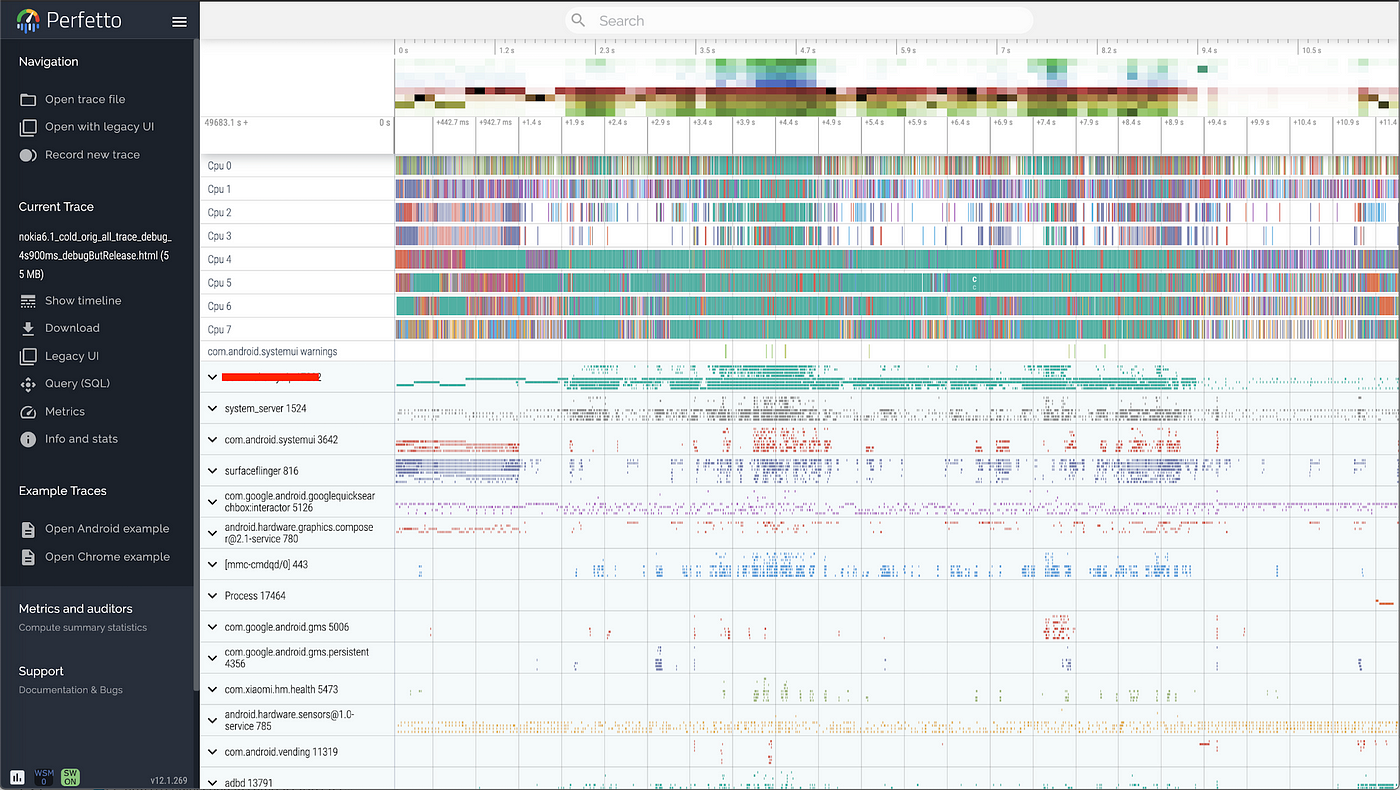
Too much of information in too little space is enough to give a WTH feeling to many and can deter from getting into the seamless ocean of system info.
So this post aims to focus on how to extract the information out of this and utilise it for advanced improvement tasks.
Let’s decode the information hidden in SysTrace
1. Process Info
The left portion displays all the device-wide processes that are running and those we have specified while capturing trace.
Processes on the left column
Processes include system processes and the application process along with per thread row information (visible on clicking the drop-down).
This is the starting point of any analysis and generally the first step is to locate the package of the app you are trying to optimise.
2. Scheduler Slices
The first few rows ( marked as CPU X ) represent the thread/process being scheduled on each of the CPU cores at any point of time.
CPU Scheduling info.
This information is handy when you need to investigate issues like why your thread of concern is not being scheduled by CPU. If other threads are being prioritised over your thread too often, then this may indicate that your thread priority might require an uplift
3. Thread State
Above each thread slice, the multi-colored line shows the state of thread at any given time — Running, Runnable, Sleeping, Uninterruptible sleep/Block IO and so on..
Thread state row above every thread row.
This can be extremely useful to identify certain issues or abnormalities.
Running- This means the thread is being scheduled on one of the cores and currently executing its code.
Runnable- This means the thread is ready to execute, and is waiting for its turn to be scheduled by CPU.
- If a thread spends majority of time in runnable state, you need to cross-check if the thread priority is an issue ( As explained in section — Scheduler Slices )
Sleeping- This is state when thread has nothing to do or it is waiting on some type of lock to proceed further.
- If main thread of application is sleeping, may be because thread is blocked on a mutex lock, it can be a matter of concern. It needs to be cross-checked that what is blocking the main thread by checking the owner of monitor-contention as below.
Main Thread sleeping — blocked on certain lock
Uninterruptible sleep -Block I/O — This means your application is doing some I/O operations and waiting for the data from IO port. When data is received from IO port, interrupt happens and thread will resume its work.
4. Rendering Info :
This is very important part of the trace which can help identifying the frame related issues like Slow rendering, Frozen frames, App responsivity to input events and even the App Startup times.
Watch-out for the main thread under your process( MAIN UI thread of application has same thread Id as processId) and also the Render Thread. Under the trace Choreographer#doFrame occurs the task of frame creation ( Measure, Layout and Draw steps of underlying View) while RenderThread renders this frame to hardware ( Trace → DrawFrame).
Frame Creation and Rendering
This part of trace can give a lot of insights like:
- Overall time of a frame (creation+Render) tells you whether it confirms to the 16 ms timeframe allotted for each frame
Optimum Frame → < 16 ms
Slow Frame → >16 ms
Frozen Frame → >700ms
- Time distribution of various phases of frame rendering like measure, layout, draw etc. help in identifying exact pain points and hence areas of improvement.
- View components inflated and their exact individual cost. This can be a motivation for you to checkout the possible causes of delay like heavy bitmap loading, Deep view hierarchy and/or use of inefficient layout component.
- Unexpected scheduling of any task on main thread in-between this flow of view rendering, might become a cause of jitter. One such example can be when you started a Service before the view creation starts and system schedules the callback OnServiceConnected in between any of the steps. You may think of off-loading any heavy work done in OnServiceConnected to worker threads.
Jobs
5. Heap Size :
The trace also provides the heap size occupied by the application at any point of time. This information may help to identify if there is any correlation between the increase in heap size and compromised performance of the application. If this happens, think of reducing the memory footprint of your application.
 Heap Size info
Some additional markers in the TraceView
Touch Interactions :
Spotting the point of User Input ( like click, swipe etc. ) can be a good point to start for any timing analysis. Like when we need to analyse why it took so long for some task to execute after user interaction. Analysing what was scheduled on main thread at that moment can help in such investigations.
Class Loading :
Look out for ‘VerifyClass [package-name]’ in the trace report to know when a particular class is being loaded.
 VerifyClass trace info
There are several ways in which this can be useful:
- When and where — This trace marker gives the point of time at which a class is initialised and thread in which this happens. If this happens on main thread and you work out that initialisation can be deferred or delegated to worker thread, it can free up the main thread and fasten up your App Performance.
- How long ?- If you notice comparatively larger width of VerifyClass block, it might be an indication that class might be heavy to instantiate and hence taking longer times and larger heap. If such is the case, consider breaking down your big monolithic classes into smaller chunks that are loaded at different times as per requirement.
- What my thread is executing ?- This is another indirect but very useful info that can be extracted using this trace. If there is a section of trace where a particular thread is in running state but there is no specific trace info to know what exactly is going on at this point of time. As below:
In such scenario, look out for the VerifyClass traces and they may assist to backtrack to the action that is being performed or the function that is being executed at that time.
Parsing through the VerifyClass traces gives a hint that Firebase initialisation is going on during this window.
Legacy UI — Some exceptions
There are few useful things that you will find in the legacy view additionally (Opening Html in browser rather than in Perfetto)
- There are frame indicators which easily tell you when a frame is being rendered. Also the colour coding tells if the frame rendered within stipulated time. ( Green — < 16ms , Orange > 16 ms , Red >700ms [Frozen frame])
- In addition, the UI thread and Render thread area associated with this frame is highlighted for easy analysis.
- If the frame is janky, even alerts are thrown in the bottom as shown in Fig. below.
 Alerts
Dedicated Alerts
There is a section in the top-right which also lists down all the alerts from the trace and suggestive fixes. This info can also be of great help for performance issues.
Note: In order to utilise all the above features, remember to do all the monitoring on Android API 29+ device and with debuggable true ( buildType can be release or debug ). Otherwise one or the other info as described above may not be available from framework.
So this was about applying the ocean of info available in System Trace to some real practice. It can still take you some time, experience and expertise to exploit this fully but hope that next time you open a Trace to fix a jitter in UI, it does not give you the jitters !!

