

 DALL·E generated image (cartoon of sleeping mammoth in a jungle)
This is a post about how a false positive performance issue (i.e. Main thread sleeping for ~1 second during App launch) made me waste many days in debugging and identifying the root cause. This issue was only observable when profiling a release build, and that is also on a device which was constrained on memory (RAM) and CPU power.
Background
Let’s cover some background first. If you’ve recently tried your hands on profiling an Android app to identify/debug some performance issues or just to capture Startup Timing metrics, then you might be familiar with very common yet very useful recommendation that you should always profile on release builds.
The rationale behind using release builds while profiling is that debug builds incur significant and varied performance degradation, and are not useful for measuring timing accurately. This performance degradation can be attributed to one of the many debug build’s capability which allows developers to attach a debugger at any point of time, which requires tracking lot of things like memory and stacktraces.
But since release builds are meant to be non-debuggable and more performant it doesn’t track anything out of the box and hence are not profileable. To address this issue Android team introduced profileable manifest configuration in API 29 which is safe to be kept even in release builds, which allows us to profile a release build with very less overhead in performance and minimal concern of data exposure as no memory data is readable by the host profiling tools and the shell process.
The Issue
I faced this Main thread sleeping issue when I was profiling our app on different sets of devices to reduce cold start time. To get the startup timing (i.e. TTID & TTFD) I created a macrobenchmark module in my app. The beauty of the macrobenchmark tests is that it also generates Systrace files which you can use to understand what different threads are doing at any point of time. From the test results I found few of the bottlenecks, one of the biggest one being the User attribution callback which involved a network call contributing to 20%–25% of the TTFD time.
The issue here was that we were making the User wait till we get the attribution data from the network call. From the systrace data on a low-end (2GB RAM) device we were also seeing that the Main thread was sleeping for ~1 second 😲 as can be seen in below screenshot.
Note: Main thread name will be hidden for confidentiality of the app.
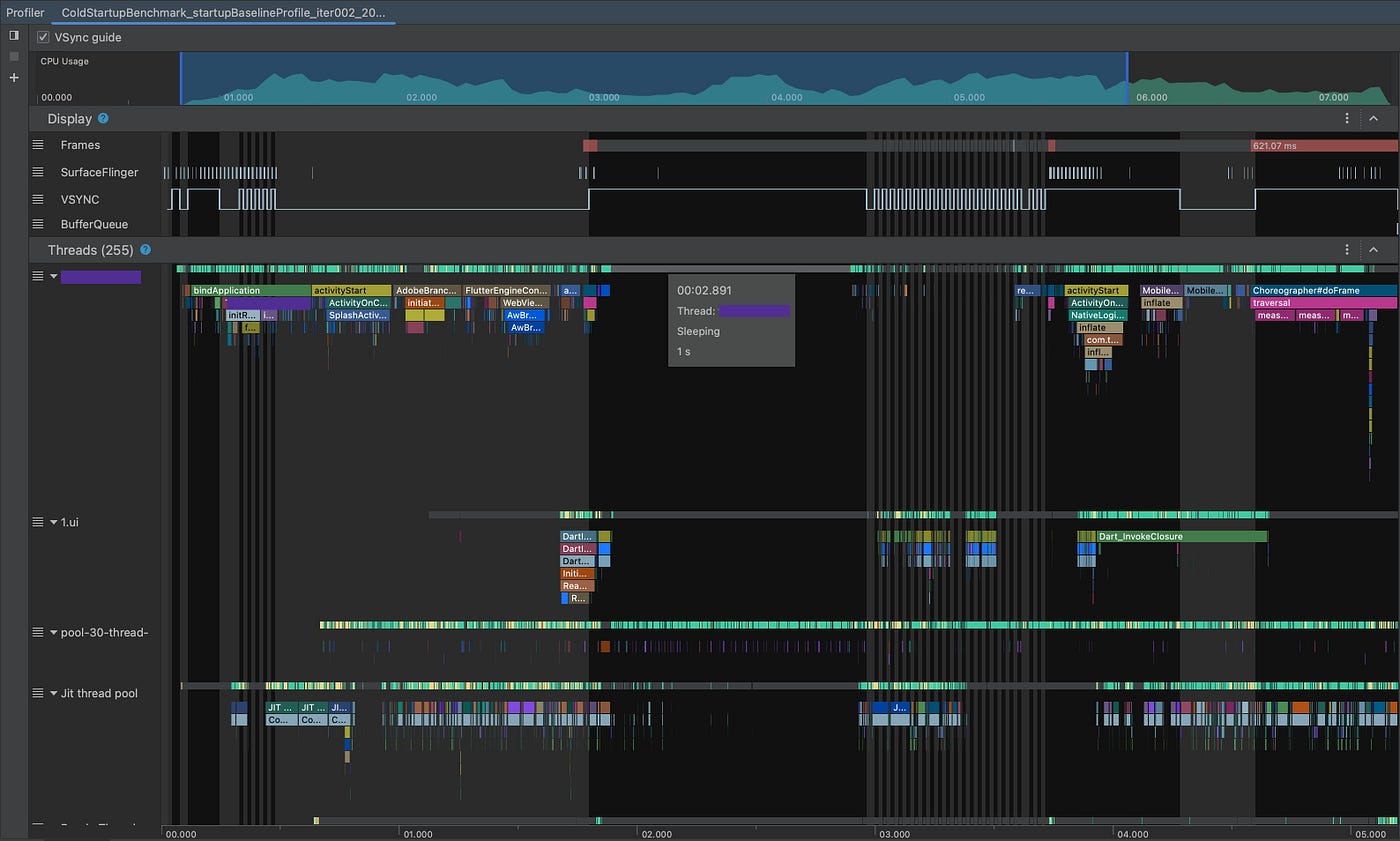 Systrace showing Main thread sleeping for ~1s
This looked like an easy win in reducing the cold start time so we kicked off the discussion with our product team and got an approval to go ahead with deferred handling of the attribution callback i.e. letting the User continue to our Home page without blocking them.
Very vigilant eyes might’ve also noticed in the above systrace screenshot that Jit thread pool is also running for a decent amount of time which can be reduced significantly by integrating Baseline Profiles. 🙂
After making the appropriate change we ran the tests again and saw our TTFD time do down by ~20% on a high end device (8GB RAM & Android 13) but on low-end device (2GB RAM & Android 10) it was still very much same. As a first step of troubleshooting we ran the Startup Timing test again (like many other things in life, the first troubleshooting step is always to retry the failed step again 😉) but the result was still same 😅.
Then I ended up spending few days to identify the issue which might be causing the Main thread to sleep for 1s but didn’t find anything. Then one day I was randomly looking at what every single thread spawned by our app was doing when Main thread went to sleep and finally I found the culprit. It was the Sampling Profiler thread which was for some reason only seemed alive for 1s (exactly at the same time when Main thread was going to sleep) where for majority of the time it was also sleeping as shown in the below screenshot.
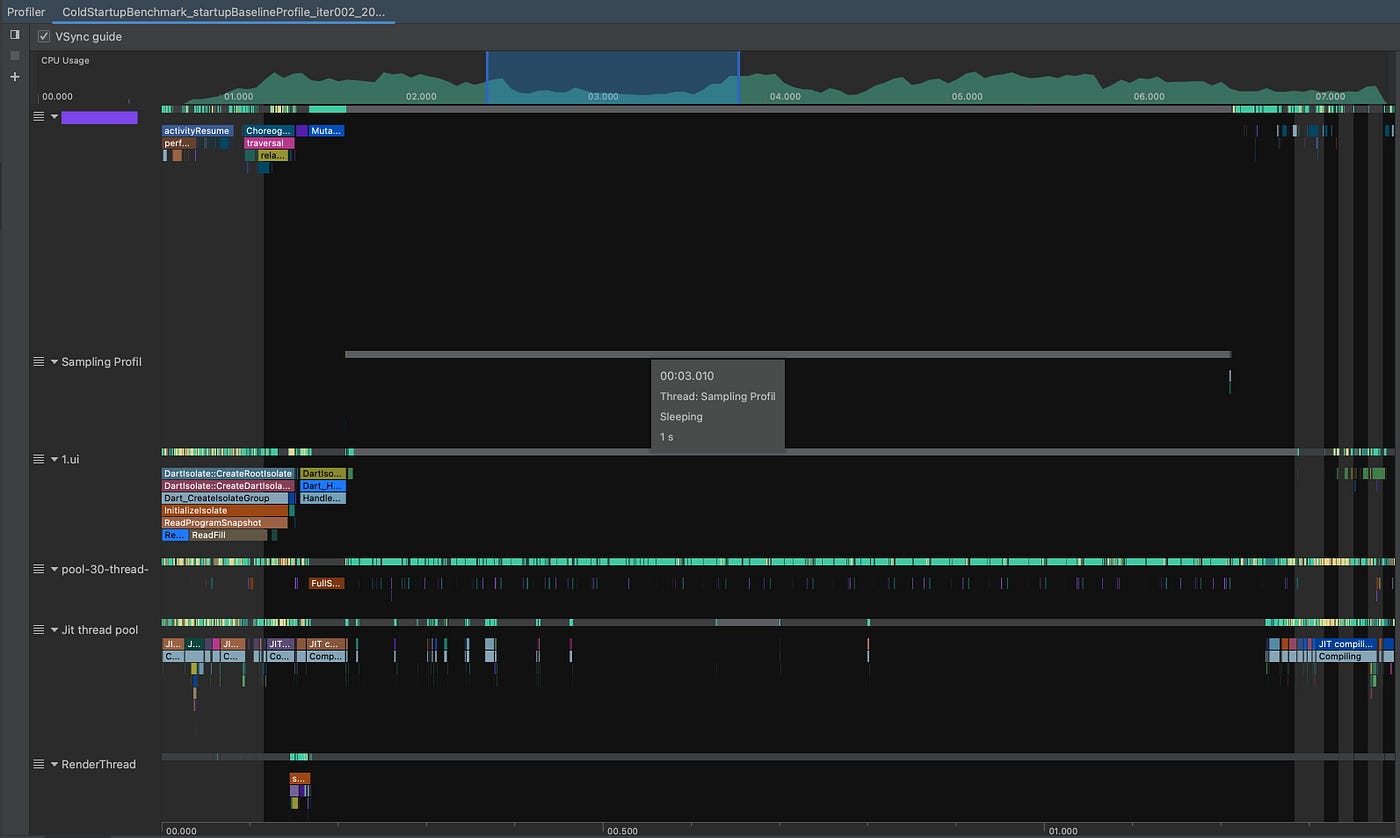 Sampling Profiler thread being alive and sleeping for 1s at the same time as Main thread goes to sleep
OUR VIDEO RECOMMENDATION


Jobs
Checking the traces for Sampling Profiler thread I found that it was doing mainly two operation which were AttachCurrentThread & DetachCurrentThread as shown below.
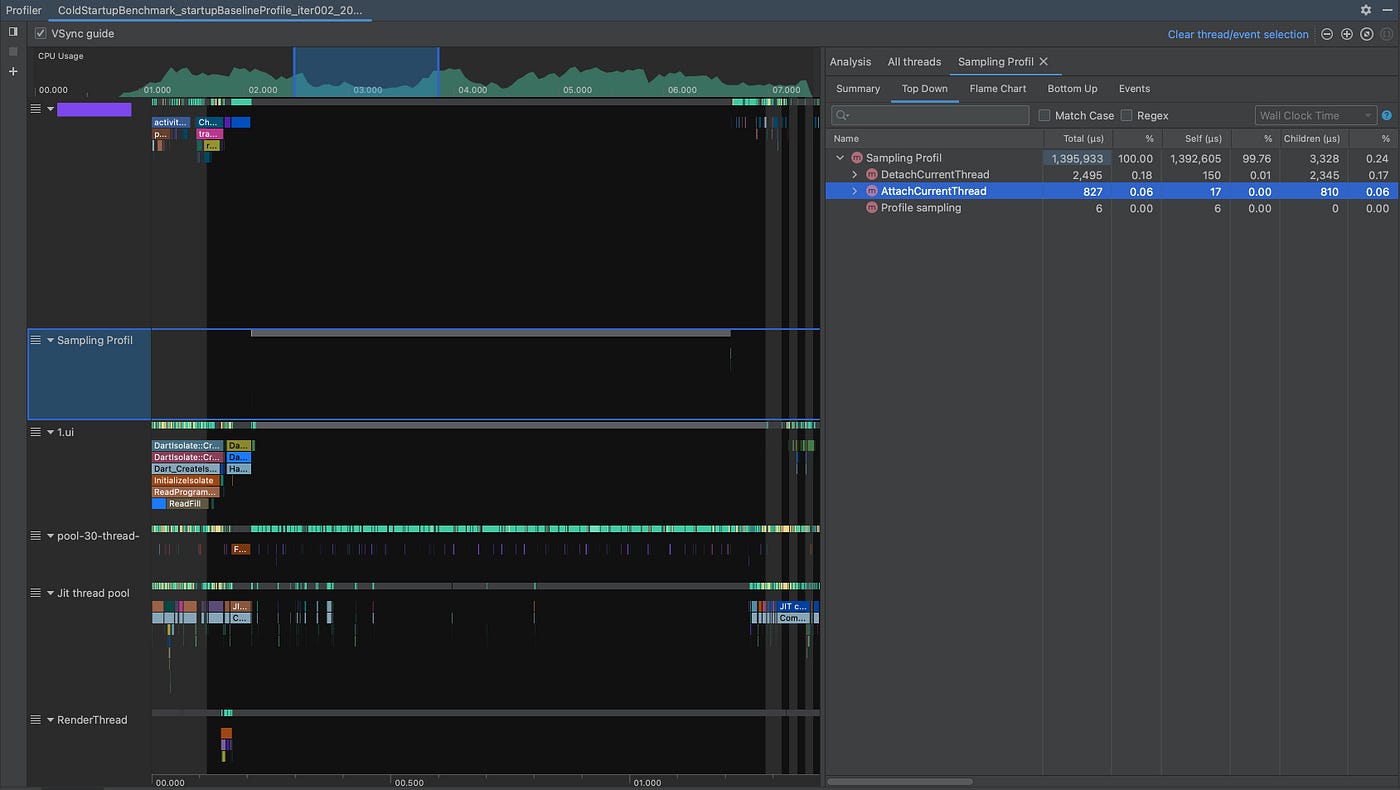 Trace logs of Sampling Profiler thread
I also tried moving a lot of code here and there to see if there was some specific condition which can lead to start this Sampling Profiler thread, one very loose correlation that I saw was whenever Main thread seemed free for few hundreds of millis the Sampling Profiler was spawning to do it’s work.
As the name “Sampling Profiler” suggests it seemed doing some work related to profiling, so we concluded that it should not be affecting actual User sessions. But since we still wanted to be sure about it I removed the <profileable> element from the Manifest file to ensure that the app is not even profileable when capturing the traces. And since I removed the <profileable> element I was no longer able to run benchmarking tests properly so I ended up using Capture/Record Trace option present in Developer Options to capture the trace file. And after looking at the trace files we confirmed that the 1s Main thread sleep issue was finally gone 🙌.
Conclusion
Even though <profileable> was adding 1s delay in most of the macro timing metrics i.e. TTID & TTFD it’s not possible to keep it removed as it’s very much needed to run the benchmarking tests. So we finally concluded that before using any kind of macro timing metric on low end devices we will remove 1s from the reported time (after analyzing the trace files).
Hope this post saves you guys few hours if not days time in debugging an issue which doesn’t even affect actual Users 🙂.
Reference Material Links and Credits:
- https://developer.android.com/studio/profile
- https://developer.android.com/guide/topics/manifest/profileable-element
- https://android.googlesource.com/platform/libcore-snapshot/+/refs/heads/ics-mr1/dalvik/src/main/java/dalvik/system/profiler/SamplingProfiler.java
Hope you liked reading the article. Please feel free to reach me on Twitter. Thank You!
This article was previously published on proandroiddev.com


