

Introduction:
Inthe dynamic world of Android app development, monitoring API calls is not just beneficial; it’s often crucial. Understanding the intricacies of requests and responses, including the details of headers exchanged, can be pivotal in optimizing app performance and debugging. Let’s consider a scenario: an API in your app starts misbehaving, leading to unexpected crashes. Or perhaps, the backend team raises a concern that your app isn’t sending a required parameter in a specific payload. In such instances, having the right tools to monitor and scrutinize every request your app makes becomes invaluable. These tools not only assist in pinpointing the root cause of issues but also play a key role in optimizing the overall request-response cycle for better efficiency and reliability.
By leveraging API monitoring, developers gain deeper insights into how their app communicates with the server, leading to quicker resolution of issues and a smoother user experience. In the forthcoming sections, we’ll explore popular tools and techniques that can help you effectively monitor API calls, interpret the data you gather, and use this information to refine your Android application.
Now let’s explore 🕵️♂️ what are the options available today.
Using Facebook Flipper:
Overview:
Flipper is a library from Facebook that is not limited to monitoring network calls; it also offers a lot of other debugging tools, such as viewing databases in the app, shared preferences, checking the XML layout, and much more. However, for today, we’ll focus only on its capabilities in monitoring API calls.
How to use:
To get started, begin by adding the following dependencies into your build.gradle file:
| dependencies { | |
| val flipper_version = "0.243.0" | |
| debugImplementation("com.facebook.flipper:flipper:$flipper_version") | |
| debugImplementation("com.facebook.soloader:soloader:0.10.5") | |
| debugImplementation("com.facebook.flipper:flipper-network-plugin:$flipper_version") | |
| releaseImplementation("com.facebook.flipper:flipper-noop:$flipper_version") | |
| } |
Note the release implementation is a no-op and it should be there so we don’t have to initialize Flipper only in debug builds.
Then we need to initialize Flipper library and let it know in which plugins (features of Flipper) we are interested in.
| override fun onCreate() { | |
| super.onCreate() | |
| SoLoader.init(this@App, SoLoader.SOLOADER_ALLOW_ASYNC_INIT) | |
| AndroidFlipperClient.getInstance(this@App).apply { | |
| addPlugin(FlipperModule.networkFlipperPlugin) | |
| start() | |
| } | |
| } |
This initialization is done in the Application class to make sure it is done only once (as this might slow down the start-up time of the application one could move this to a later step after onCreate() )
FlipperModule is an object class for simplifying Dependency Injection
Note that In a real world example this would be a module providing the dependency using Dagger, Koin or Anvil.
Now we need to add an interceptor to instance of OkHttpClient:
| object OkHttpModule { | |
| val okHttpClient = OkHttpClient.Builder() | |
| .addInterceptor(FlipperOkhttpInterceptor(FlipperModule.networkFlipperPlugin)) | |
| .build() | |
| } |
We need to create an instance of FlipperOkhttpInterceptor and add it as an interceptor to OkHttpClient. FlipperOkhttpInterceptor needs an instance of NetworkFlipperPlugin which we created above (Note that same instance needs to be passed!)
That’s it! Now we need to head to https://fbflipper.com/ and download a Flipper client matching our system, After downloading it we need to set it up and help it to find where adb is in our system. after doing so if you run the app on a emulator or a device we can see the following in the Flipper client:
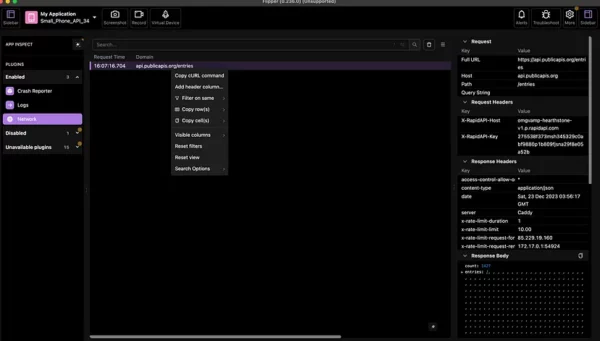
Now we can:
- Inspect all properties of a request and response
- Share cURL command with the backend team
- Copy the response to be used for unit tests
- And much more!
Pros and Cons:
✅ Request and responses can deeply be inspected. Since this is happening on your machine, it’s easier to navigate, debug and copy/paste headers, etc.
✅ Could also be used in an iOS application
❌ An external app is needed for inspection
❌ Setting up Flipper can be cumbersome sometimes (especially on Windows machines)
❌ Flipper libraries add several KB to the application size in debug mode
For more information check Flipper’s Github page:
https://github.com/facebook/flipper/?source=post_page—–f804be039c5a——————————–
Using Chucker:
Overview:
Chucker is an Android library that can be used for inspecting HTTP API calls like “Charles” but on the device, It’s a big deal to be able to see what API calls are being made when testing the app and make sure everything is correct, you’re not limited to just see the calls but sharing the full request and response headers and body and also sharing the cURL command.
for every API call, a notification is made which can quickly be accessed when needed.
How to use:
To get started, begin by adding the following dependencies into your build.gradle file:
| dependencies { | |
| debugImplementation "com.github.chuckerteam.chucker:library:4.0.0" | |
| releaseImplementation "com.github.chuckerteam.chucker:library-no-op:4.0.0" | |
| } |
Note that the actual library will only be added to debug builds and for release builds we’re using a no-operation version of the Chucker which basically does nothing.
Now it’s time to integrate Chucker into our networking stack:
| val chuckerCollector = ChuckerCollector( | |
| context = this, | |
| // Toggles visibility of the notification | |
| showNotification = true | |
| ) | |
| val chuckerInterceptor = ChuckerInterceptor.Builder(context) | |
| .collector(chuckerCollector) | |
| // Controls Android shortcut creation. | |
| .createShortcut(true) | |
| .build() | |
| val client = OkHttpClient.Builder() | |
| .addInterceptor(chuckerInterceptor) | |
| .build() |
Jobs
Along with many other configurations that Chucker has, we can toggle to show/hide the notification when network calls are being made and also create an app launcher shortcut to quickly access the API calls.
In the end, we create an OkHttp interceptor and add it to our OkHttpClient instance.
https://miro.medium.com/v2/resize:fit:640/format:webp/1*OnoMc15GE8SKD4Qid8pcdQ.gif
Debugging API calls directly on the Android device
Pros and Cons:
✅ Request and responses can be inspected. Since this is happening on the device it’s easier for non-developer members of your team or QA to share the network stacktrace when needed.
✅ No external app is needed, everything is happening on the device.
✅ Easy setup compared to Flipper, just add the dependency and configure the OkHttpClient instance
❌ Can sometimes reduce the performance of debug builds as all the network calls go through Chucker’s interceptor
For more information check the Chucker’s Github page:
https://github.com/ChuckerTeam/chucker?source=post_page—–f804be039c5a——————————–
Using Android Studio:
Android Studio’s Network Inspector could also be used for monitoring API calls of the application, No extra tools or libraries are needed for this and everything happens through Android Studio.
To open the Network Inspector, follow these steps:
- From the Android Studio navigation bar, select View > Tool Windows > App Inspection. After the app inspection window automatically connects to an app process, select Network Inspector from the tabs. If the app inspection window doesn’t connect to an app process automatically, you may need to select an app process manually.
- Select the device and app process you want to inspect from the App Inspection window.
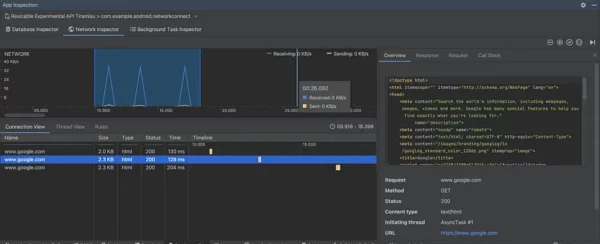
If everything goes well the window above should be displayed.
Pros and Cons:
✅ Requests and responses can be inspected in real-time
✅ No external app or dependency is needed, everything is happening using Android Studio
✅ No setup time. Just navigate through windows and enable the Network Inspector view
❌ Only engineers can use this, would be harder for other team members like QA to check API calls if needed.
For more information check the official documentation from Google below:
Using Android Studio’s Logcat:
We can also leverage “ADB logcat” to monitor API calls as they are being made. These logs need to be discovered through all the things that happen in the logcat (It’s a lot right?!) or some good filters need to be applied to the logcat so we only see what we’re interested in.
Let’s get started by adding the following dependency to the build.gradle file:
| implementation("com.squareup.okhttp3:logging-interceptor:4.12.0") |
Now we can add this to our OkHttp instance as below:
| val logging = HttpLoggingInterceptor() | |
| logging.setLevel(Level.BASIC); | |
| OkHttpClient.Builder() | |
| .addInterceptor(logging) | |
| .build() |
Note that we’ve set the logging level to be “Level.BASIC” in the code above, there are other logging levels like NONE, HEADERS, and BODY which as their name suggests can be used to log different details of an API call and of course this will affect performance of the logcat and also application.
Note also that the code above will log all API calls even for release builds which might not be something that we want, We can use the code below to have this enabled only for debug builds:
| val logging = new HttpLoggingInterceptor() | |
| val level = if (BuildConfig.DEBUG) Level.BASIC else Level.NONE | |
| logging.setLevel(level) | |
| val client = OkHttpClient.Builder() | |
| .addInterceptor(logging) | |
| .build() |
Pros and Cons:
✅ Requests and responses can be inspected in real-time in logcat
❌ It’s harder to navigate through the logs in logcat as many things are happening there and it’s easy to exceed the Logcat’s buffer limit and don’t get any logs when needed.
❌ External dependency is needed, everything is happening using ADB (In Android Studio or Terminal)
❌ Only engineers can use this, would be harder for other team members like QA to check API calls if needed. They need to setup ADB and debug the application.
Conclusion:
We’ve discussed the following:
- Flipper
- Chucker
- Android Studio
- ADB Logcat
Each of them comes with its pros & cons and everything drills down to your needs. In my opinion, Chucker is a good option as it provides a very easy-to-use tool for everyone in the team from QA to managers to inspect API calls if needed. For developers maybe Flipper would be a good option as it has detailed information and can be used for other purposes that are not limited to network inspection.
If we have no time to set up anything, Android Studio’s Network Inspection could be a good option for quick debugging.
This blog is previously published on proandroiddev.com


