

RxJava & LiveData patterns that lead to unexpected memory leaks
It’s hard to imagine building an Android application in 2022 and not reaching for a reactive architecture powered by RxJava, LiveData, or Kotlin Flow. Though these libraries are powerful, they can also be a source of unexpected and hard to spot memory leaks. Recently we found two very subtle leaks that had been resident in our app for many months. In this article, we will explore the causes and provide a quick summary of the tools we can use to debug memory leaks.
A trip down memory leak lane
About a year ago, we refactored a good chunk of our remaining legacy codebase to follow our modern MVVM architecture. Very excited as we always are when cleaning our code, we deployed the change. But.. our excitement went away after we started getting reports of random crashes in various areas of our app.
The Crashlytics logs were unhelpful. We were seeing untraceable OOM errors in every screen of the app. Literally we were seeing hundreds of crashes, each with a different stack trace, in a different part of our codebase.
So how do you debug this situation? You look for patterns.
After investigating the logs we did find something common. All crashing users had done a lot of swiping!

To give you context, we are a dating app. Among other features, people can swipe on profiles until they find their match.
Next thing we did was to try to replicate that scenario. I opened the Memory Profiler in Android Studio and started swiping profiles. Then I had a “uh-oh!” moment. The allocated memory was constantly increasing while I was swiping with no signs of decreasing:

What’s happening? Isn’t the garbage collector’s (GC) job to clean up objects no longer needed and free up the memory? Well yes, but the objects should be no longer needed!
I certainly don’t need the profile I swiped 50 swipes ago in memory. That’s why I use a ViewPager in the ProfileViewActivity that will host a maximum of three ProfileViewFragments at a time (the current visible one, the previous, and the next one). But.. apparently our code was instructing otherwise.
Next thing I did was to capture the heap dump to analyze the allocated objects in memory and this is literally what I got:
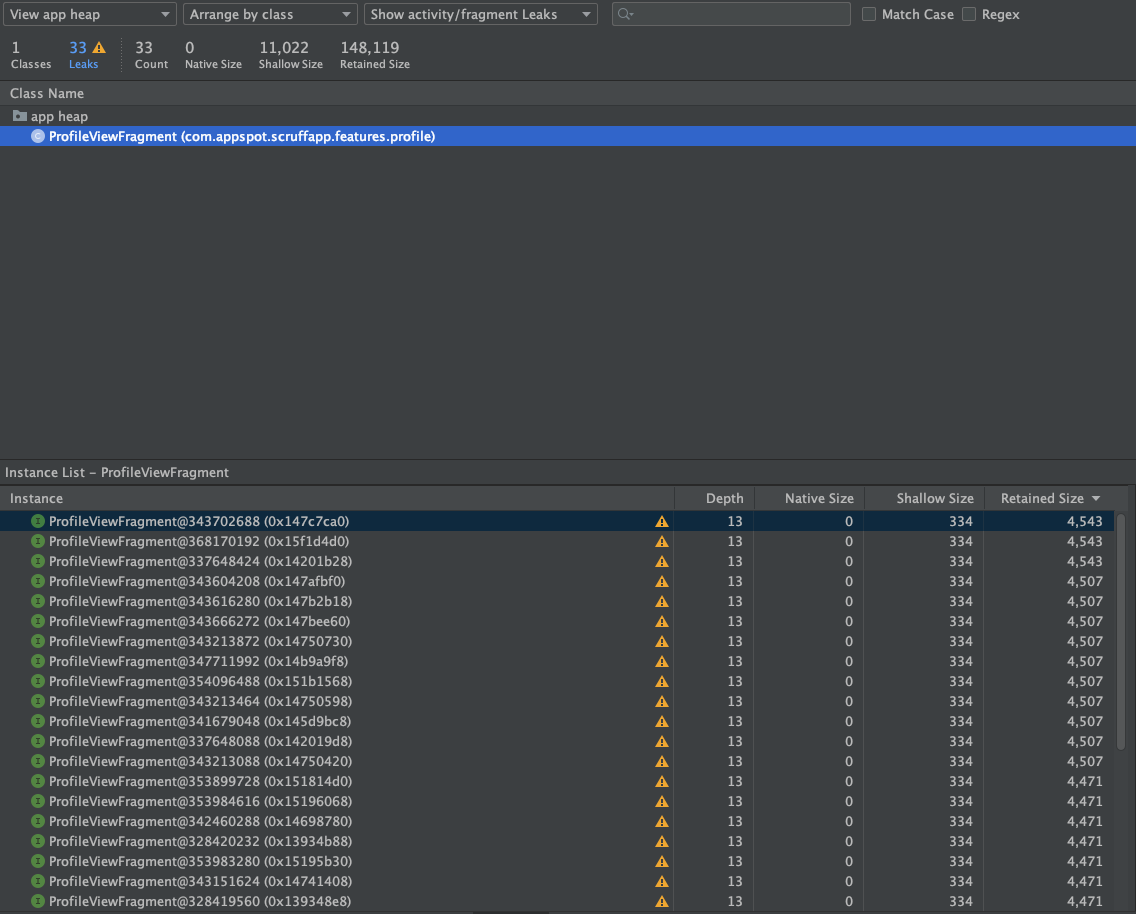
⚠️ 33 leaks! ️33 instances of the ProfileViewFragment currently in memory! No wonder why the allocated memory constantly increases as I swipe.
Then I checked the code in that fragment and saw this scary little thing:
| override fun onCreate(savedInstanceState: Bundle?) { | |
| super.onCreate(savedInstanceState) | |
| ottoBus.register(this) | |
| } | |
| override fun onDestroy() { | |
| // empty | |
| } |
It turns out we were registering a listener to the fragment as a leftover of our legacy codebase, but never unregistering it! (Otto was an event bus library that was pretty popular before RxJava became mainstream.)
The listener holds a strong reference to the fragment and even if the fragment gets destroyed, the listener is still active and the GC assumes that we need that object even if we don’t. In other words, the listener leaks the fragment. And that’s what the memory leak is:
An object in memory that is no longer used, referenced by another object that is in use, making the GC unable to clear it and free up the memory.
Note: In languages that use Automatic Reference Counting (ARC) such as Swift, a memory leak can happen even if there aren’t any external references, if we have two objects that hold a strong reference to each other. This is what is called a retain cycle. This is generally not an issue on Android because Java GC is using a mark and sweep algorithm. See this blog post for an interesting insight on the symmetry between the two GC approaches.
And how is it related to the OOM errors? Android sets a hard limit on the heap size allocated for each app, depending on the device and the available RAM. The more leaks we have, the faster we’ll reach the heap capacity, hence the system won’t be able to allocate more memory to the new objects that we’ll try to create and it will throw an OutOfMemoryError.
That’s exactly why OOM errors can happen anywhere in the code, even in classes that don’t cause any memory leak themselves, making the stack traces unhelpful and the issue hard to debug.
Since then our awareness of memory leaks has increased and we’re regularly performing checks to confirm that we are not leaking any memory.
Let’s look at some additional real-life cases we have encountered in our app that have caused a memory leak.
Reactive Leak #1: Subscribing to LiveData using the wrong Context
Do you remember those RecyclerView.Adapters before migrating to Jetpack Compose? Well, I’m pretty sure that a lot of codebases still depend on them, considering Compose is fairly new.
Let’s suppose you have a fragment that renders a RecyclerView through an Adapter. How would you observe a list of items and update the Adapter? Normally you would have a LiveData of items in your ViewModel that you subscribe to and then dispatch the updates using a DiffUtil.
But where would you define that subscription? There are two possible options: you either create the subscription in the fragment and then send the updated list of items to the Adapter, or you could pass your ViewModel to the Adapter and have the Adapter observing the changes directly.
In the latter case, there is a high chance you’ll create a memory leak.
First, let’s take a look at this code:
| class MyAdapter( | |
| private val context: Context | |
| ) : RecyclerView.Adapter<RecyclerView.ViewHolder>() { | |
| init { | |
| viewModel.items.observe(/* ??? */) { | |
| // Update items and dispatch updates | |
| } | |
| } | |
| // ... | |
| } |
We want to start a subscription in the init block of the Adapter. The first argument of the LiveData observe() method is a LifecycleOwner, which can be any class that has an Android lifecycle. If we start a subscription in an activity or a fragment then we would use this to tie the subscription to the lifecycle of the activity or the fragment itself.
But.. this doesn’t work within the Adapter because the Adapter is not associated with an Android lifecycle. Hmm.. but in our example we do pass a Context to the constructor of the Adapter so that we can access resources and load images. That can be probably used as a LifecycleOwner right? After all, it’s the fragment’s context so it is associated with a lifecycle.
Let’s try this:
| class MyAdapter( | |
| private val context: Context | |
| ) : RecyclerView.Adapter<RecyclerView.ViewHolder>() { | |
| init { | |
| viewModel.items.observe(context as LifecycleOwner) { | |
| // Update items and dispatch updates | |
| } | |
| } | |
| // ... | |
| } |
Is it compiling? ✅
No complaints from the linter? ✅
Working as expected when we run the app? ✅
But as you may have guessed, we have just created a memory leak! Although we use the fragment’s Context in the Adapter, that Context is actually the activity that hosts the fragment. Fragments cannot have a Context out of an activity.
And what does that mean for our subscription? It means that our subscription is tied to the lifecycle of the activity. The subscription will remain active as long as the activity is alive. So if we exit that fragment, even if we no longer need it, the GC cannot free up that memory because there is an active subscription in the adapter that lives within the fragment.
We have a fragment in memory that we no longer need and that cannot be cleaned up. And that is especially problematic in single-activity architectures where that fragment will be continuously recreated when the user enters the respective screen, but never cleared until the user exits the app.
In order to fix this issue, instead of casting the Context to a LifecycleOwner we can explicitly pass the fragment’s view lifecycle to the constructor of our Adapterand tie our subscription to it:
| class MyFragment : Fragment() { | |
| // ... | |
| fun setupAdapter() { | |
| myAdapter = MyAdapter(context, viewLifecycleOwner) | |
| } | |
| } | |
| class MyAdapter( | |
| private val context: Context, | |
| private val viewLifecycleOwner: LifecycleOwner | |
| ) : RecyclerView.Adapter<RecyclerView.ViewHolder>() { | |
| init { | |
| viewModel.items.observe(viewLifecycleOwner) { | |
| // Update items and dispatch updates | |
| } | |
| } | |
| // ... | |
| } |
OUR VIDEO RECOMMENDATION


Jobs
That way, the subscription will be automatically disposed once the fragment’s view is destroyed.
Reactive Leak #2: Not clearing RxJava subscriptions
Observing an RxJava stream has a lot of advantages over a simple LiveDatasubscription, mostly because of the flexibility and vast variety of operators that RxJava provides.
In addition, RxJava allows us to observe one-time events with the use of PublishSubject which is not possible with LiveData without hacky workarounds.
One important thing that we lose though is the ability to tie a subscription to an Android lifecycle. As we mentioned in the previous example, when we observe()a LiveData we need to specify a LifecycleOwner and that will allow the subscription to be automatically disposed once that LifecycleOwner is destroyed. That way, we don’t need to worry about clearing the subscription when the activity or fragment is destroyed.
Let’s look at the following RxJava stream:
| class ChatViewModel( | |
| private val chatLogic: ChatLogic | |
| ) : ViewModel() { | |
| fun observeChatMessages() { | |
| chatLogic.chatMessages | |
| .observeOn(AndroidSchedulers.mainThread()) | |
| .subscribe({ | |
| // On next: update the state | |
| }, { | |
| // On error: update the state | |
| }) | |
| } | |
| } |
We’re starting a subscription in our ViewModel to observe chat messages while we’re chatting with a user and we update the state once the list of messages is updated.
But that subscription never gets disposed, so even if the ViewModel gets cleared, it will remain active. That means that the associated activity or fragment won’t be deallocated from memory even after the user exits that screen. In other words, we have a memory leak.
In order to protect us from memory leaks related to RxJava subscriptions in our app, we have established the following two patterns:
Defining an RxViewModel
Our ViewModel inherits from a base RxViewModel that will automatically dispose the subscriptions in onCleared() which is called when the associated activity or fragment is destroyed:
| open class RxViewModel : ViewModel() { | |
| protected val disposables = CompositeDisposable() | |
| override fun onCleared() { | |
| super.onCleared() | |
| disposables.dispose() | |
| } | |
| } |
The only thing that we need to do is to add each subscription to our disposablesso that they’ll be automatically cleared:
| class ChatViewModel( | |
| private val chatLogic: ChatLogic | |
| ) : RxViewModel() { | |
| fun observeChatMessages() { | |
| disposables += chatLogic.chatMessages | |
| .observeOn(AndroidSchedulers.mainThread()) | |
| .subscribe({ | |
| // On next: update the state | |
| }, { | |
| // On error: update the state | |
| }) | |
| } | |
| } |
Clean MVVM activity & fragment lifecycle
We have developed our own lifecycle methods for activities and fragments that among other things (such as protecting us from Android process deaths), they also protect us against incorrect usage of RxJava subscriptions. You can read more in the following blog post series that describes our approach in detail:
Bonus: Dingbat memory leaks you’ll only learn through experience
This leak has nothing to do with reactive programming and is likely a flaw in the design or implementation of the ConnectivityManager. That service allows us to check if the users have an active internet connection and whether they’re on Wi-Fi or mobile data. We discovered this leak while debugging one of the prior memory leaks.
In order to obtain the current instance of the ConnectivityManager we can use the getSystemService() method of the activity:
| val connectivityManager = getSystemService(Context.CONNECTIVITY_SERVICE) as ConnectivityManager |
It turns out though that the ConnectivityManager holds a static reference to the Context that it was provided. In our case, we implicitly provide the Context of the activity and since the ConnectivityManager holds a strong reference to it, our activity cannot be cleaned up from memory even after it has been destroyed.
The fix is simple, although definitely not documented. Instead of calling the getSystemService() of our activity, we’ll use the getSystemService() of the application’s context:
| val connectivityManager = applicationContext.getSystemService(Context.CONNECTIVITY_SERVICE) as ConnectivityManager |
That way, the ConnectivityManager will hold a strong reference to the application’s context which is exactly what we want for singletons since they are tied to the application’s lifecycle.
How to debug a memory leak?
The most popular tools we have at our disposal to detect and debug memory leaks is the Android Profiler and LeakCanary.
Android Profiler
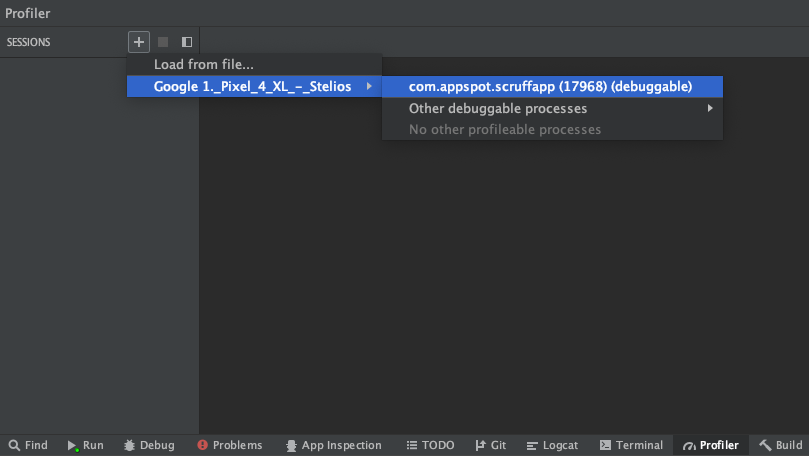
The documentation for profiling memory usage in Android Studio is already very extensive, but in summary we first have to open the Profiler (View > Tool Windows > Profiler), start a new session, and select the device and the process we want to debug:
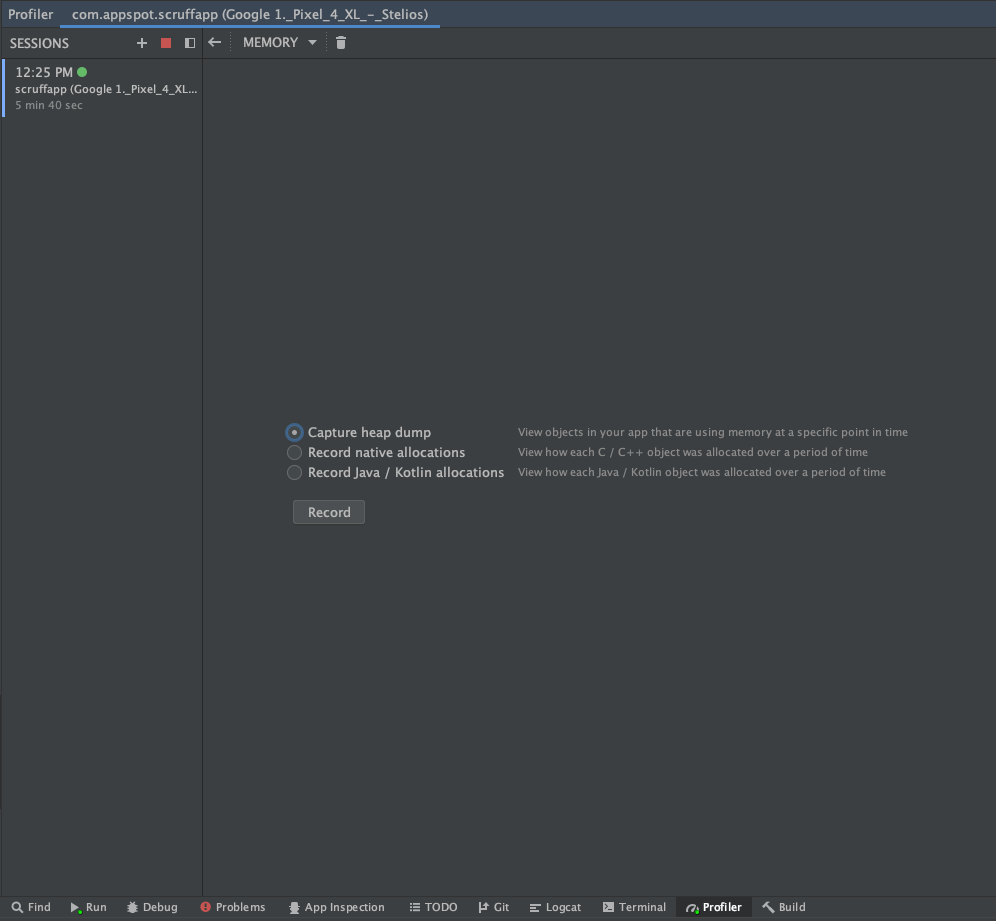
Then we have to select the Memory option and start interacting with the app, mainly by entering and exiting the suspicious fragments and activities. Lastly, we click the Capture heap dump option and select Record.
In the captured heap dump, we can see all objects of our app that are stored in memory at that time including any memory leaks. If we select the object that is leaking, we can view all instances of it and all references to it. That can help us identify the source of the leak.
LeakCanary
LeakCanary is an open source library that runs along the app, observing onDestroy() events of activities and fragments, and logs the retained objects. After a certain threshold of retained objects, it will capture a heap dump and send a notification to our device with any potential memory leaks. The downside of this approach is that it will freeze the app every time it dumps the heap since the heap dump occurs in the same process as the app.
Even the best developers leak sometimes
Our recent experience with these memory leaks demonstrates that they can be very difficult to reason about or predict merely through code reviews. Any application that is regularly updated should also consider as a best practice running ad-hoc testing using the tools above several times per year and definitely after a major refactor.
About the author
Stelios Frantzeskakis is a Staff Software Engineer for Perry Street Software, publisher of the LGBTQ+ dating apps SCRUFF and Jack’d, with more than 30M members worldwide.
This article was originally published on proandroiddev.com on March 22, 2022


