

A high-quality app is always a requirement for any organization that wants to reach a large userbase for example if an app keeps on crashing, getting stuck on screen, or even taking a longer time to load content on screen then that’s a very good indication that the app quality is really not up to the mark and a lot of things can be done to improve the app performance and provide a better user experience.
However, the major question is how do you being the app developer or from the organization side monitor such things?

Firebase Performance Monitoring is here to help, a powerful service that’s available for Android, iOS and Web even the best part is that it’s free of cost too.
Automatically Measured Metrics
Following are the metrics that are recorded automatically just by adding the performance monitoring SDK.
1. App startup time — Android, iOS
2. Page loading — Web
3. Screen rendering — Android, iOS
4. Network request — Android, iOS & Web
How does it work?
To report metrics on the Firebase the performance monitoring uses traces to collect data about the processes. Trace is nothing but the report that contains data captured between two points in time in your app. Metrics are collected performance data for each trace. Let’s understand this with an example say if you are doing a network call then the trace collects metrics that are important for network request monitoring like response time, payload size, network call successful or failed etc.
Add Firebase Performance Monitoring to the Android app
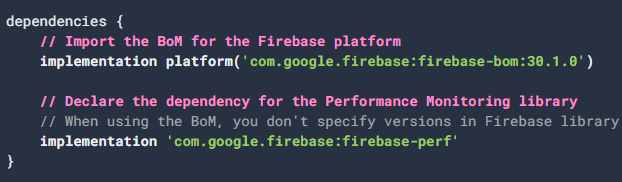
Create a project on Firebase by providing your app application id and thereafter adding the JSON file to your android app directory and adding the following dependencies in the Gradle file
 https://firebase.google.com/docs/perf-mon/
 https://firebase.google.com/docs/perf-mon/
 https://firebase.google.com/docs/perf-mon/
That’s it, now the performance will be monitored automatically.
Duration Metrics
Now as we have added the SDK so here are the duration metrics that will be calculated automatically.
- App start trace: This trace measures the time between when the user opens the app and when the app is responsive. The less the duration the better it is.
- App in foreground trace: This measures the time when an app is running in the foreground and is available to users. So higher duration for this means users are often interacting with your app.
- App in background trace: This measures the time when the app is running in the background.
Screen Rendering Metrics
Well, a slow rendering or even frozen frame can lead to poor app performance so both of them are measured automatically too.
- Slow rendering frame: Measures the percentage of screen instances that takes longer than 16ms to render.
- Frozen frame: Measures the percentage of screen instance that takes longer than 700ms to render.
Network Request Metrics
It automatically collects a trace for each network request issued by your app. These traces collect metrics for the time between when your app issues a request and receives the response.
- Response time: Time between when the request is made and when the response is fully received.
- Response payload size: Byte size of the network request downloaded by the app.
- Request payload size: Byte size of the network payload uploaded by the app.
- Success rate: Percentage of successful responses (response codes in 100–399 range) compared to total responses.
All the above metrics are certainly helpful but you may need some custom traces or metrics too, like how much time a particular function takes to execute itself or the duration to read or write a local database, etc. So with Firebase Performance Monitoring, you can also record the custom traces and metrics.
OUR VIDEO RECOMMENDATION


Jobs
Custom Traces
If you are adding the custom trace to your android app then there are two ways to do so, first way is to use the trace object like below.
 https://firebase.google.com/docs/perf-mon/
In this approach, you have to create a trace object by specifying its name and calling the start() and stop() method explicitly.
The second approach is by using the annotation like below.
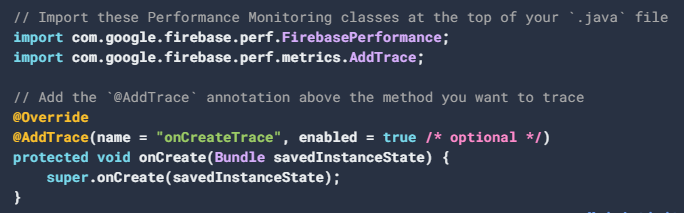 https://firebase.google.com/docs/perf-mon/
Here the name of the trace is provided with the annotation itself, this trace will automatically record the start and end duration of onCreate() method hence no need to explicitly call the start() or stop() method like the earlier approach.
This was all about adding and monitoring the app performance using one of the free services offered by Firebase — Firebase Performance Monitoring.
This article was originally published on proandroiddev.com on June 28, 2022


