

Yeah! you just read that. Today I’m going to show you how to build your own chart (this time, a linear one). No extra libraries need it, only Jetpack Compose UI and a small amount of math.
⚠️ Before we start I want to tell you something. This blog is going to be pretty straightforward, therefore, I assume you already have experience working with Jetpack Compose, at least the basics like configuring your project, what are “composables”, how to they work, etc. because that is not described here️.
Alright, let’s start! 🚀
Android View System 🌲
I’m almost 100% sure that you have experience working with Views like TextView, EditText, etc. or ViewGroups like ContraintLayout, LinearLayout, etc. and how to they operate together. Yes, those components are Views & ViewGroups.
If you want to know the internals of them, I highly recommend this talk from one of the greatest, Huyen Tue Dao.
Droidcon NYC 2016 — Measure, Layout, Draw, Repeat: Custom Views and ViewGroups
Back to our main subject, how do we render something like a chart?
In the “old” view system we have to do it from scratch by extending the View class and overriding it’s onDraw(canvas: Canvas) method. With that done, we could play with the canvas object and literally draw anything you can imagine.
Drawing on Android 🖌️
Custom drawing happens thanks to Canvas (official docs), no matter if it’s on the “old” View System or with Compose. In this Canvas we can draw lines, rects, circles, ovals, paths, arcs, etc. all of that just by connecting points in it’s “own” coordinate system.
Yes, I write it’s “own” coordinate system because the start point
(0;0)🠒(x;y)
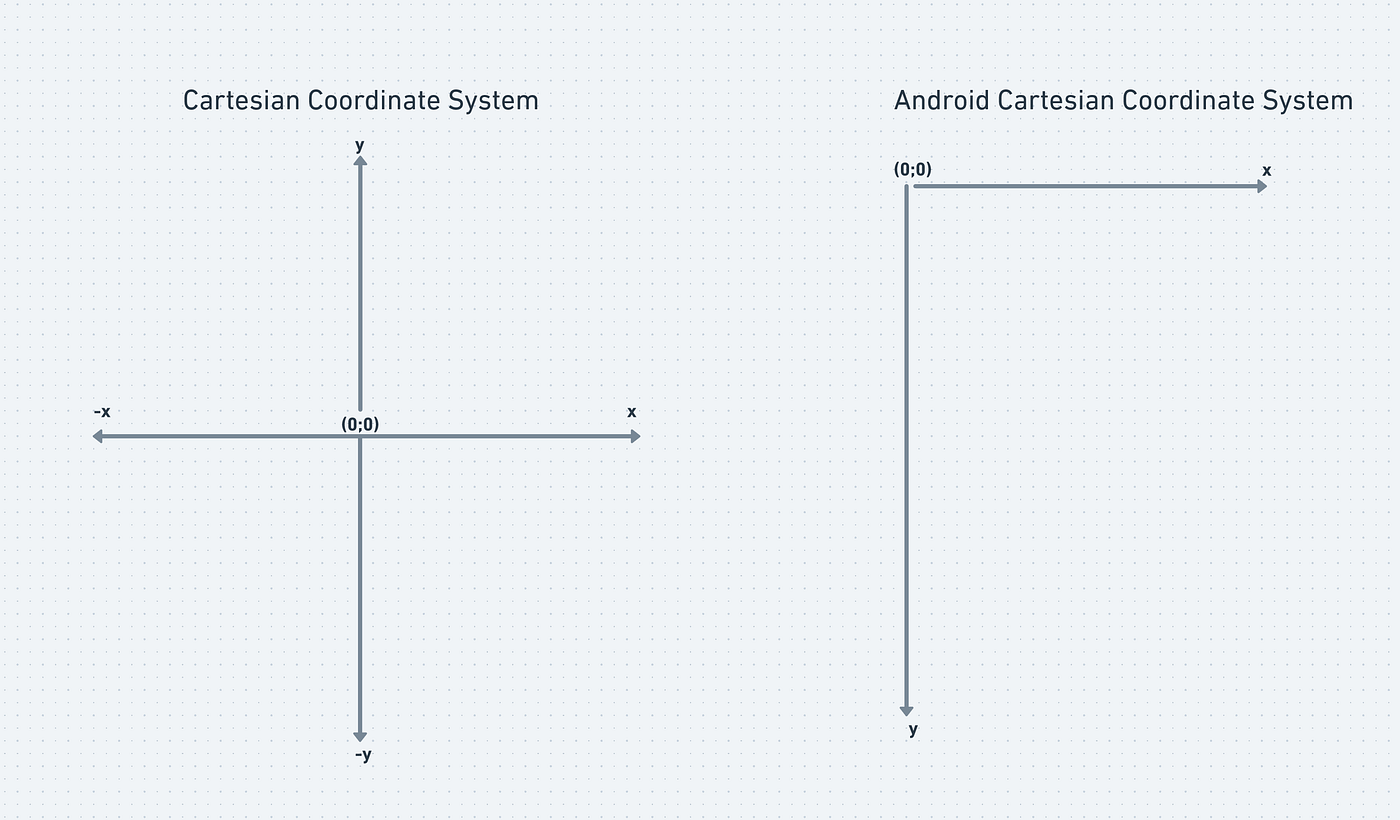 Reference of the Cartesian Coordinate System as we may already know and in Android Development
is now located in the TOP LEFT CORNER, not the center. That’s the place where our X axis and Y axis now begin (look at the image! 👆). For now on this the TOP LEFT CORNER is going to be the start point of reference for our “Canvas Coordinate System”.
wrote an amazing blog with more detail of it here, you should really read it!
Math for Draw! 🥳
Our linear chart is going to look like this:
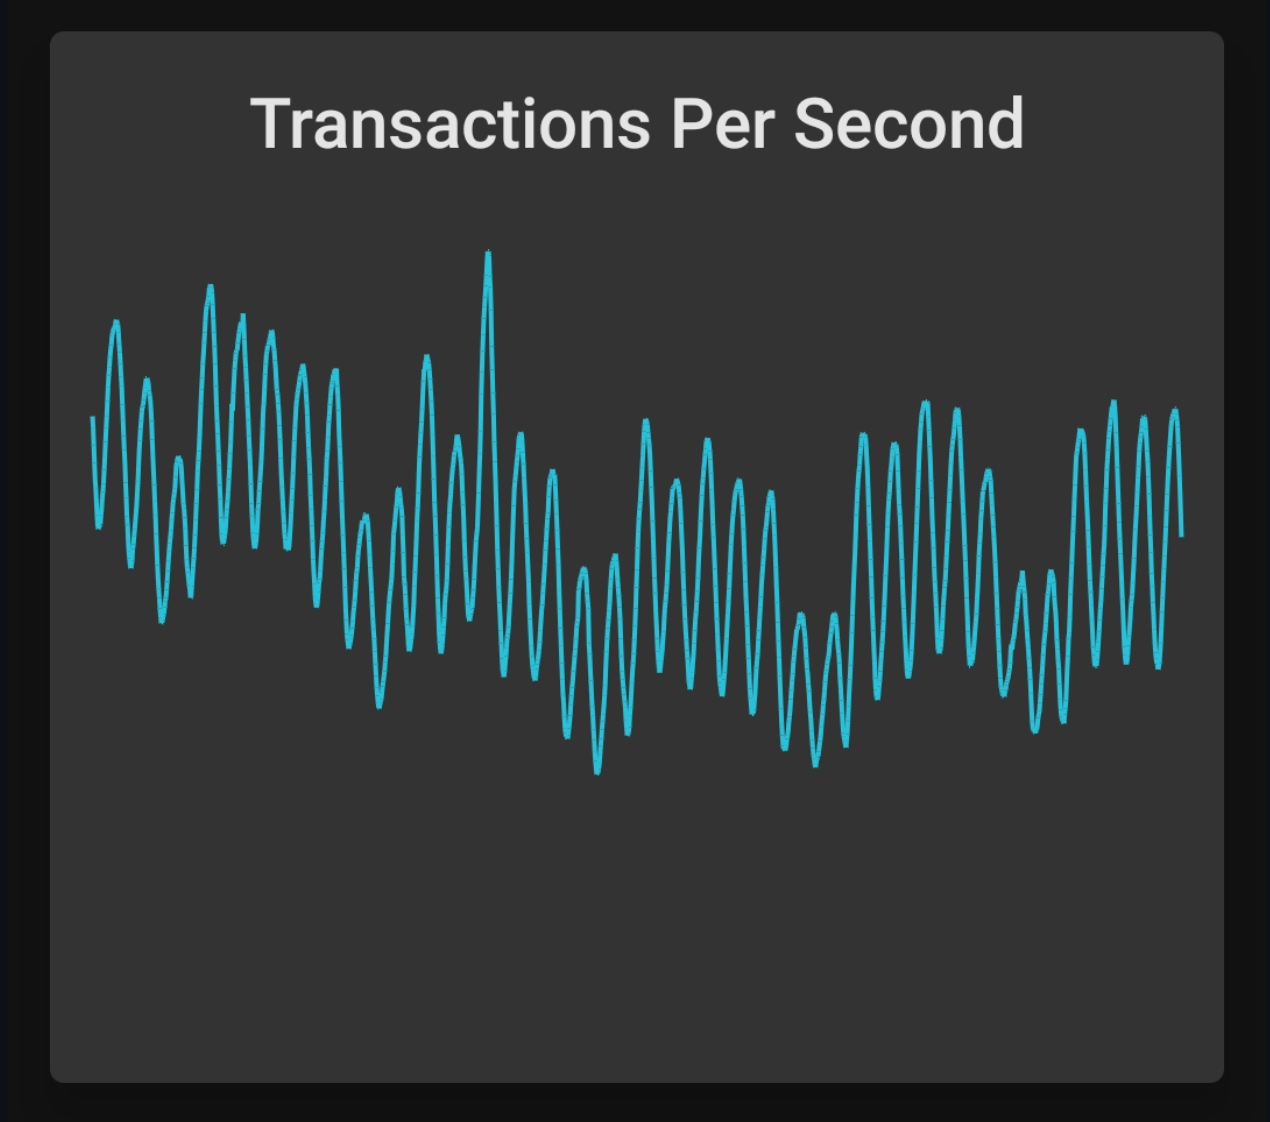 Custom Line Chart with Jetpack Compose
Let’s analyze a little bit the image:
- We can see that the whole chart has a start and an ending point, so it’s finite, and it must fit in the Width (⟷ ) of the View.
- We can see that each point represent a “Transaction” per second, and according to that “transaction” the line can go up or down.
- We know that a line is composed by two points, start(a;b) and end(c;d) and that there is a distance from “start” point to “end” point.
I think we analyze enough of that image for now. We could say we need something like this:

OUR VIDEO RECOMMENDATION


Jobs
Now we can see a bigger picture, we need a function to that takes transactions as inputs and return points for our coordinate system. We also need to know the height of our View in order to establish some height limits.
First, let’s model our “Transaction” object. For this particular case, I’m consuming the API from Blockchain.
/**
 * Represents a group of Transactions
 * @param maxTransaction the max transaction value in the list of transactions previously calculated in some repository.
 * @param transactions list of transactions per second.
 */
data class TransactionsPerSecond(
    val maxTransaction: Double,
    val transactions: List<TransactionRate>
)

/**
 * Represents a transaction rate.
 * @param timeStamp the time stamp of the transaction.
 * @param transactionsPerSecondValue the quantity of transactions made per second.
 */
data class TransactionRate(
    val timeStamp: Long,
    val transactionsPerSecondValue: Double
)
Now that we have our model set up, let’s code our composable function:
| @Composable | |
| fun LinearTransactionsChart( | |
| modifier: Modifier = Modifier, | |
| transactionsPerSecond: TransactionsPerSecond | |
| ) { | |
| if (transactionsPerSecond.transactions.isEmpty()) return | |
| Canvas(modifier = modifier) { | |
| // Total number of transactions. | |
| val totalRecords = transactionsPerSecond.transactions.size | |
| // Maximum distance between dots (transactions) | |
| val lineDistance = size.width / (totalRecords + 1) | |
| // Canvas height | |
| val cHeight = size.height | |
| // Add some kind of a "Padding" for the initial point where the line starts. | |
| var currentLineDistance = 0F + lineDistance | |
| transactionsPerSecond.transactions.forEachIndexed { index, transactionRate -> | |
| if (totalRecords >= index + 2) { | |
| drawLine( | |
| start = Offset( | |
| x = currentLineDistance, | |
| y = calculateYCoordinate( | |
| higherTransactionRateValue = transactionsPerSecond.maxTransaction, | |
| currentTransactionRate = transactionRate.transactionsPerSecondValue, | |
| canvasHeight = cHeight | |
| ) | |
| ), | |
| end = Offset( | |
| x = currentLineDistance + lineDistance, | |
| y = calculateYCoordinate( | |
| higherTransactionRateValue = transactionsPerSecond.maxTransaction, | |
| currentTransactionRate = transactionsPerSecond.transactions[index + 1].transactionsPerSecondValue, | |
| canvasHeight = cHeight | |
| ) | |
| ), | |
| color = Color(40, 193, 218), | |
| strokeWidth = Stroke.DefaultMiter | |
| ) | |
| } | |
| currentLineDistance += lineDistance | |
| } | |
| } | |
| } |
LinearTransactionChart Composable
As I already told you, Canvas is all you need for custom drawing on Android. Let’s review the gist step by step (the most important ones).
- First it uses the Canvas composable, which receive a Modifier as parameter and provide us with a DrawScope ~ Line 8.
- Because we want to “expand” our chart to fit the whole View width, let’s figure it out the “max” distance our “points” can have ~ Line 13.
- We get the Height of our canvas, because we want to limit how high or low each point can be placed in our chart. ~ Line 16.
- Inside the DrawScope mentioned in point #1 we are going to perform our operations, such as find the total number of transactions per second, transform each transaction into a valid point, draw the lines with the given points and finally render a chart ~ Line 22 and below.
- Finally we are going to iterate over all the “Transactions” and draw a line that have as start point the current transaction looping, and as end point the next transaction in the array/list.
Oh yeah, I made a small helper function for calculate the Y coordinate
| /** | |
| * Calculates the Y pixel coordinate for a given transaction rate. | |
| * | |
| * @param higherTransactionRateValue the highest rate value in the whole list of transactions. | |
| * @param currentTransactionRate the current transaction RATE while iterating the list of transactions. | |
| * @param canvasHeight the canvas HEIGHT for draw the linear chart. | |
| * | |
| * @return [Float] Y coordinate for a transaction rate. | |
| */ | |
| private fun calculateYCoordinate( | |
| higherTransactionRateValue: Double, | |
| currentTransactionRate: Double, | |
| canvasHeight: Float | |
| ): Float { | |
| val maxAndCurrentValueDifference = (higherTransactionRateValue - currentTransactionRate) | |
| .toFloat() | |
| val relativePercentageOfScreen = (canvasHeight / higherTransactionRateValue) | |
| .toFloat() | |
| return maxAndCurrentValueDifference * relativePercentageOfScreen | |
| } |
And just like that, you can implement your own LinearChart in no more than ~ 100 lines of code approximately, pretty impressing isn’t it? If you want to see the full app running check out the repo itself and don’t forget to smash the ⭐ button on it!
This small app, has a lot of improvements to be done, but I think it will help you to get started with custom drawings with out making your head explode.
So, stop procrastinating, stop avoiding these topics and start from something! Everything is practice 🙂.
See you soon in the next blog 👋! HUGE kudos to the Android Developers Team for Jetpack Compose, they are doing a great job with the library, codelabs, samples and documentation.


